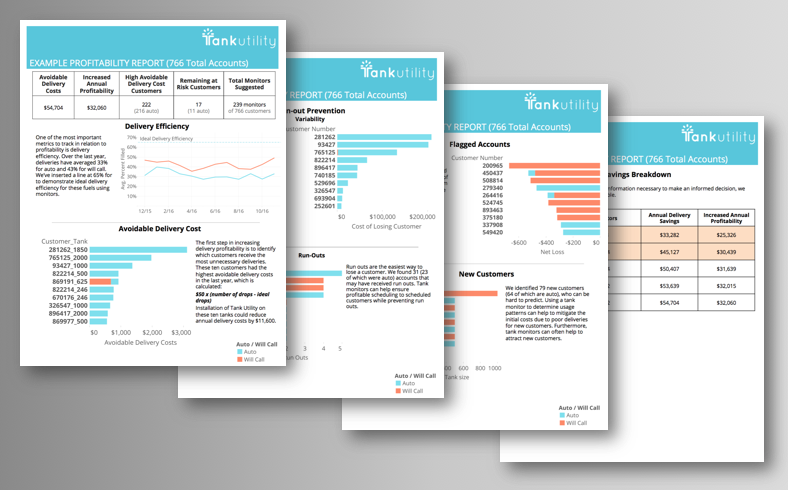
This article is part of our series on fuel delivery efficiency. Generac offers every customer our detailed Delivery Efficiency Analysis Report using their delivery history data. The report helps fuel suppliers to benchmark their performance and find ways to improve efficiency and reduce costs.
Fuel Delivery Efficiency Series:
- Fuel Delivery Efficiency Analysis Overview
- Average Drop Size – Actual vs. Ideal
- Avoidable Delivery Costs
- Accounts Where Heating Degree Days Don’t Work
- Run-Out Review
- Red-Flag Accounts
- New Customer Check-Up
Fuel Delivery Efficiency Analysis Overview
Generac offers every customer an in-depth operations report we call our Delivery History Analysis (click here to download a sample report). The idea behind a Delivery History Analysis is to take a step back and review a summary of 12-24 months worth of your distribution data. This sort of logistics performance reports can help you find ways to improve profitability and just distribution costs.
Improved profitability starts with benchmarking delivery efficiency. Finding that baseline is important to know where to start looking for improvements and as a comparison to see if the changes you may make are working.
A Delivery History Analysis report from Generac includes six key pieces:
1) AVERAGE DROP SIZE – ACTUAL VS IDEAL
A concise summary of your delivery quantity (gallons per stop) over the previous 1 or 2 years (or longer).
2) AVOIDABLE DELIVERY COSTS
The total sum of costs from over-servicing (or over-delivering) to customers. This typically results from an overabundance of caution to avoid running out customers.
3) ACCOUNTS WHERE HEATING DEGREE DAYS DON’T WORK
A focused review of customers that cannot be forecasted accurately with K-factors and traditionally pushed to will-call.
4) RUN-OUT REVIEW
A look at all of the accounts that had a run-out or had a near-run-out and the potential lost profit of losing one of those customers because of poor service.
5) RED-FLAG ACCOUNTS
A list of accounts that may be unprofitable based on the number of zero-fills (stops with no gallons delivered).
6) NEW CUSTOMER CHECK-UP
Usage patterns for new customers on automatic delivery can be hard to predict accurately, it’s often worth taking a thorough second look at these accounts after their first year or two.
 Shop
Shop


3 thoughts on “Fuel Delivery Efficiency Analysis”
Comments are closed.